Trace All the Things! Introducing Dagger Cloud v3
We’re kicking off the year with something big: a completely new user interface for our tracing product, Dagger Cloud. We call it “Dagger Cloud v3”.
What is Dagger Cloud?
Dagger Cloud provides unified, end-to-end tracing for builds and tests - agnostic to CI, development environments, languages, and platforms. Anything the Dagger Engine can run, Dagger Cloud can trace.
“What went wrong? Why is it so slow?” If you ever wasted time staring at CI logs to answer these questions, it’s time to adopt tracing. It will help you optimize your builds, and troubleshoot faster when things go wrong.
If you’ve never tried Dagger Cloud before, this is the perfect time to jump in and try it out. When you sign up, switch the toggle on the top right to “v3” to see the latest changes mentioned below.
Hello WASM, Goodbye React!
With Dagger Cloud v3, we wanted to deliver a smoother and faster experience while maintaining complete feature parity with the Dagger terminal UI, so we adopted WebAssembly (WASM).
Adoption of WebAssembly (WASM) has been one of thegrowing trends in the cloud ecosystem for the last few years. And for good reason too! WASM allows you to run code written in different programming languages (like Go, Rust, C++, etc.) to run in web browsers or other environments at near native speed.
By replacing our old React app with a WebAssembly based UI, we’ve unified the underlying business logic between the Dagger terminal and web experiences. Previously, maintaining separate implementations in TypeScript/React (for the web) and Go (for the CLI) created duplication and slowed down our ability to ship features consistently across platforms. Now, with WASM, both the terminal and web UI share the same backend codebase.To build our new UI, we leveraged Go-app, a Go framework for progressive web apps, which made it easier to bring our WebAssembly-based vision to life.
What does this mean for you?
- A more consistent user experience across all Dagger interfaces.
- Better overall performance
- Faster delivery of new features. Our team’s velocity has significantly improved, as we no longer have to implement the same functionality twice, and more of our engineers are fluent in Go than in Javascript and React
Better CI Integration
Dagger Cloud v3 works better with your CI platform. Traces sent from the same CI workflow are automatically grouped together, and laid out in an intuitive timeline format.
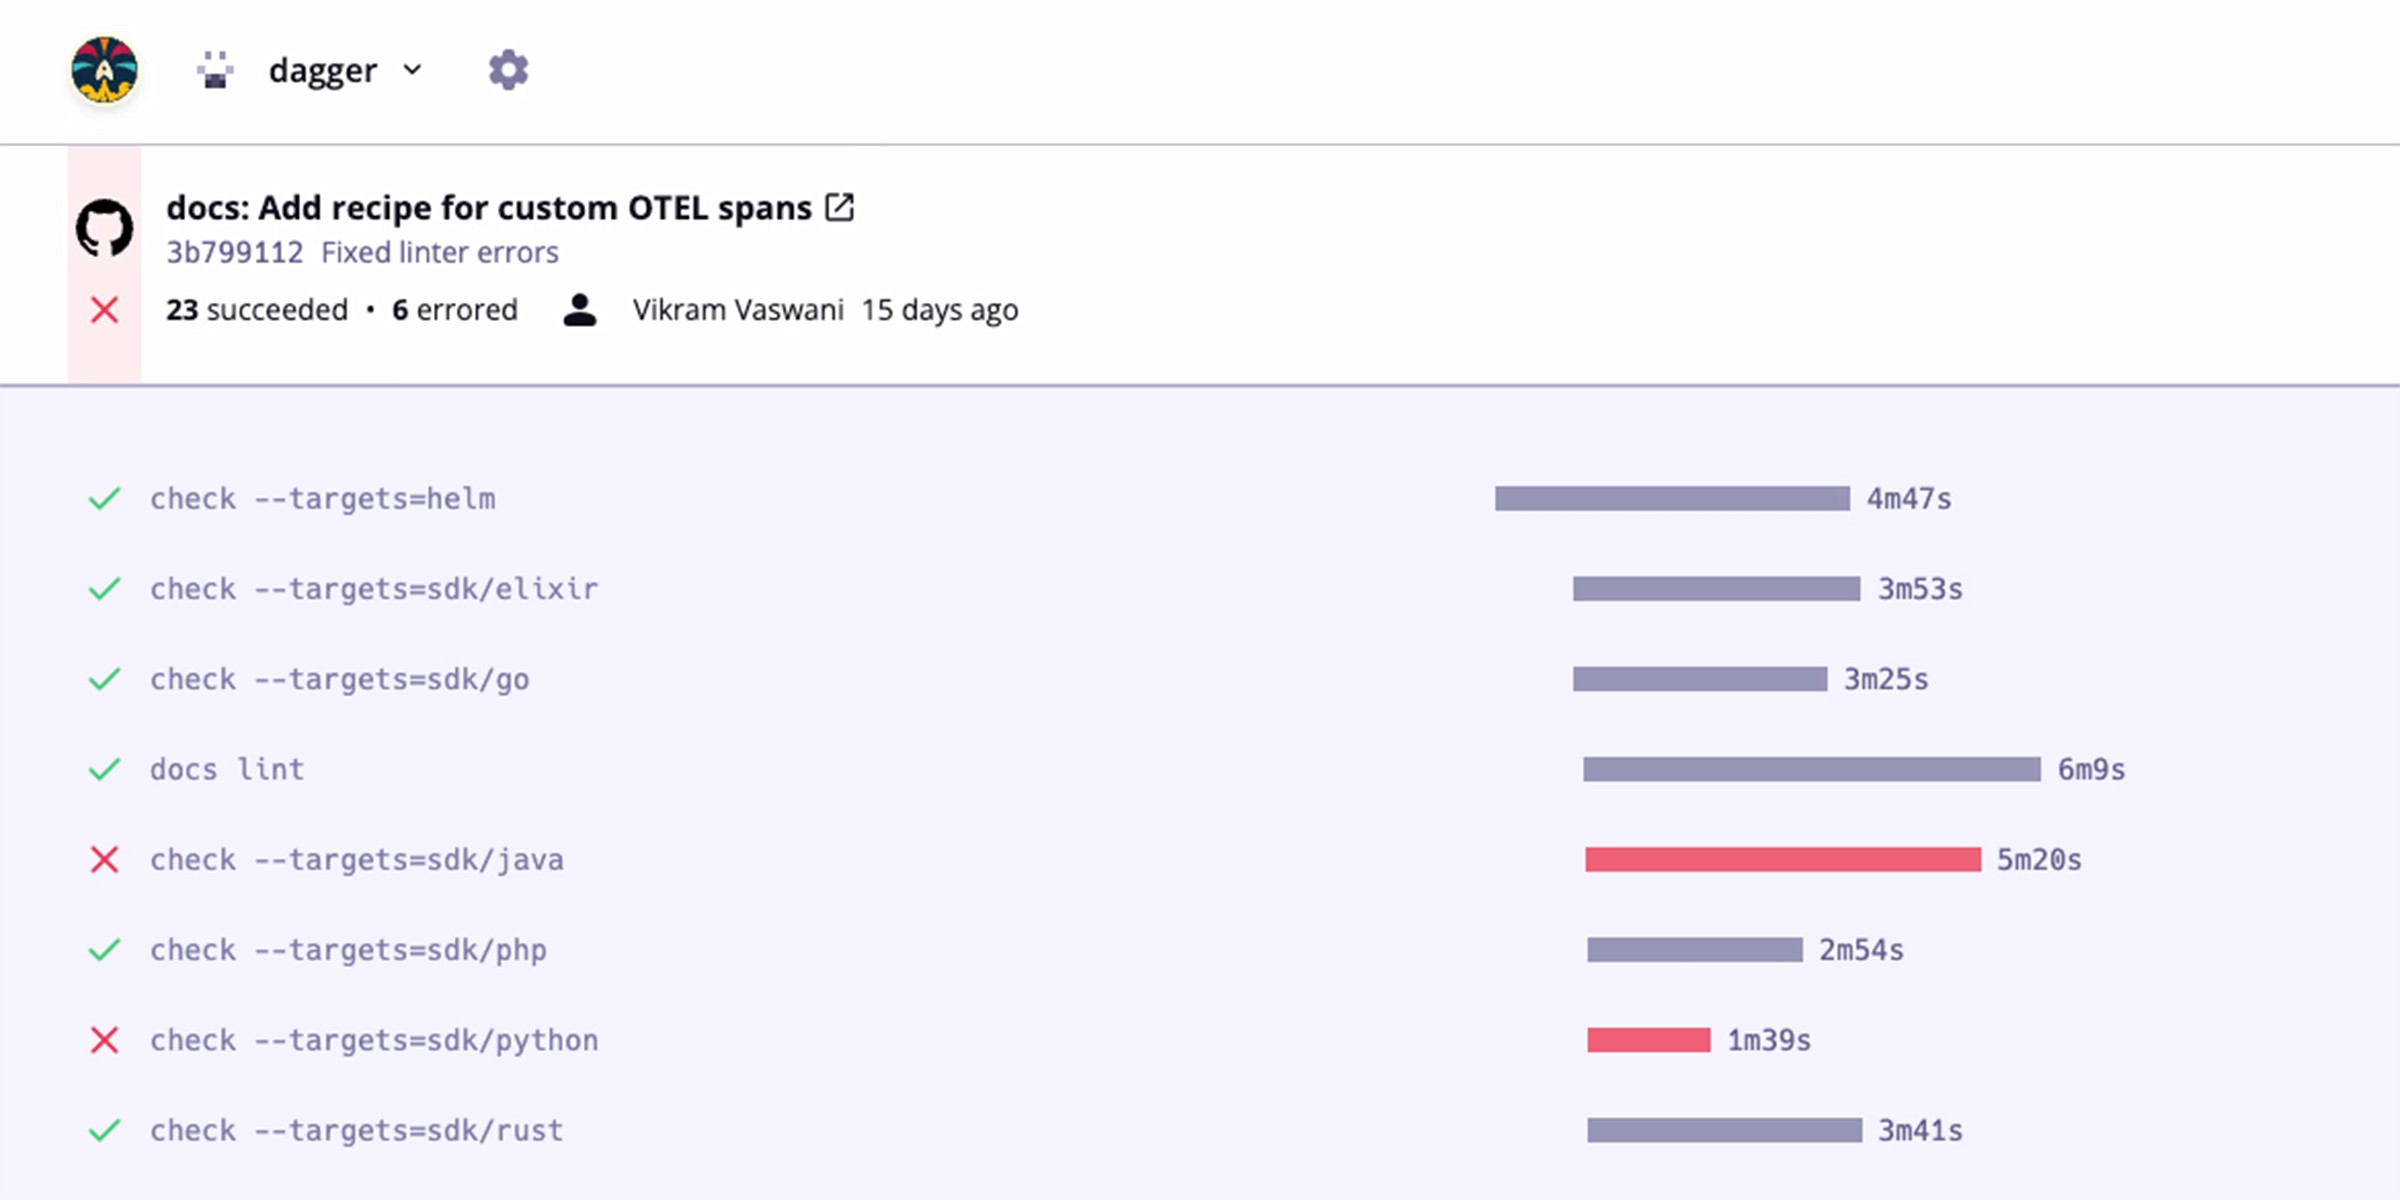
This view provides a clear breakdown of each step, making it easier to understand the performance and status of each step of your pipeline.
With the timeline view you can:
- See exactly how long each function call or step in your pipeline takes. This helps identify bottlenecks and optimize your workflows for faster execution.
- See all the traces in a single unified view allowing you to easily drill down into individual traces to understand their execution.
- Quickly pinpoint failed steps in the timeline and jump to their details immediately.
More Readable Errors
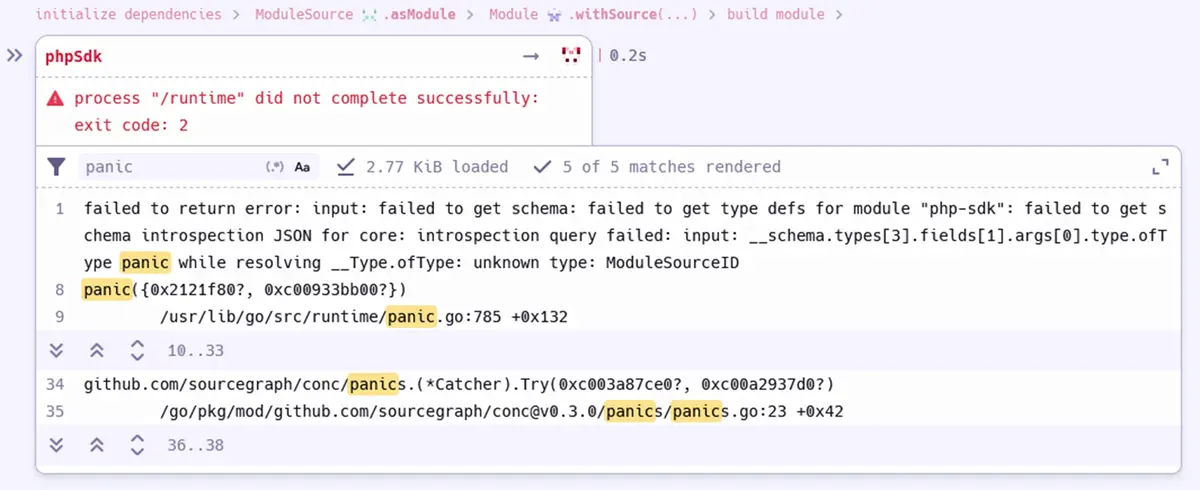
As a developer, your velocity is constrained by how fast you can read and understand errors. With that in mind, last month we improved how Dagger presents errors in the terminal. Now the same improvements are available when viewing traces in Dagger Cloud. Error messages are now highlighted in a separate section in the trace view, making them easier to spot immediately.
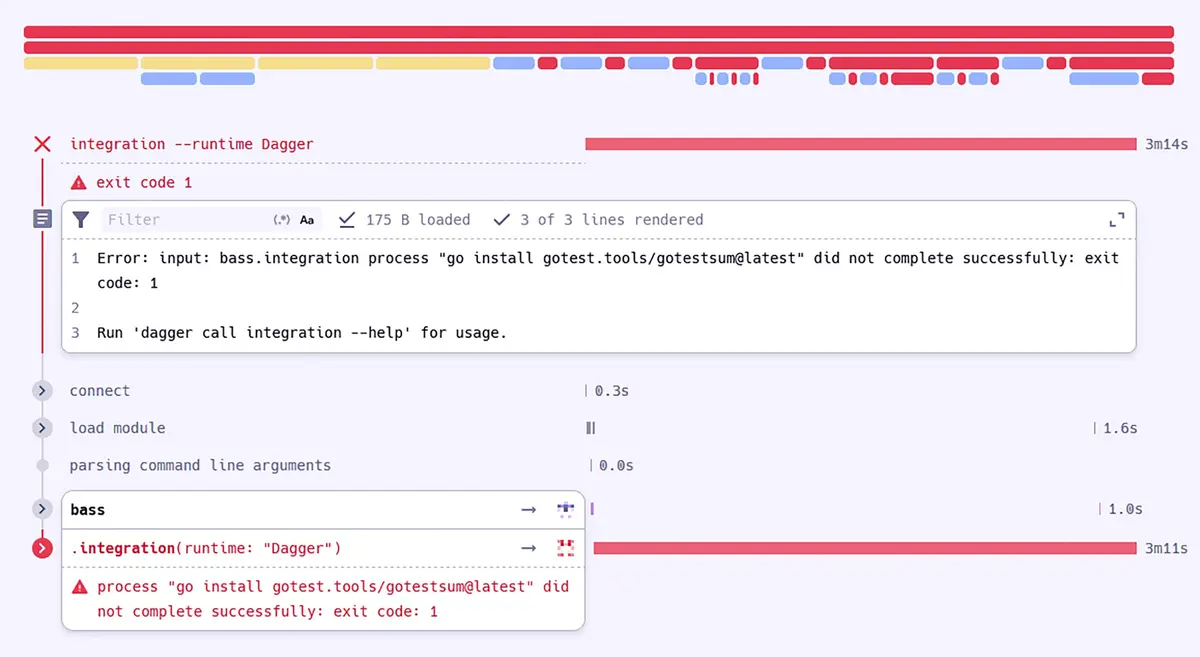
You no longer need to sift through numerousspans to find what went wrong, critical errors are surfaced clearly right where you need them. The updated error view also provides more context around where and why the issue occurred. This means you can see not just the error but also the related steps that led up to it.
While we can’t fix errors for you, we’ve designed these improvements to significantly reduce the time it takes to identify and understand errors. Instead of hunting through numerous lines of logs you can zero in on issues immediately giving you more time to ship.
Clearer Status Indicators
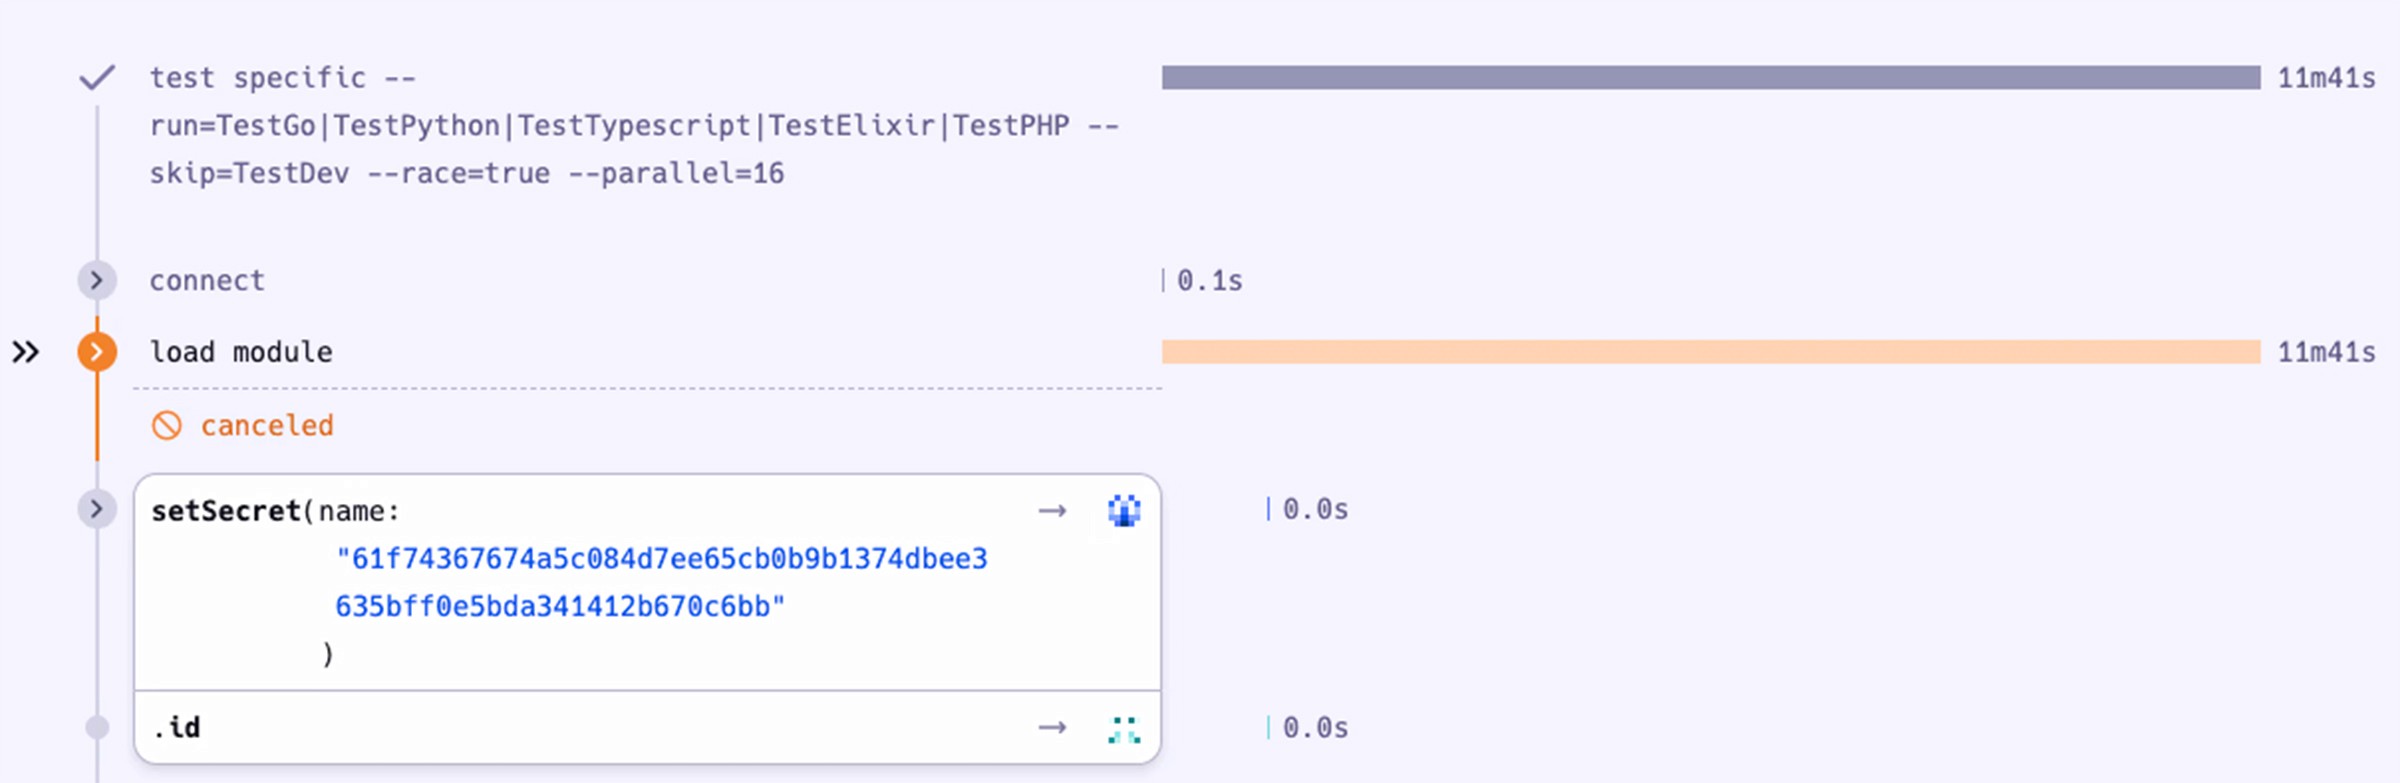
With Dagger Cloud v3, we’ve added more visual cues to make understanding the status of each step in your CI pipeline easier and more intuitive.
Running Steps: Steps that are currently in progress are highlighted with a blinking or yellow indicator. This gives you a real time view of your pipeline’s activity and makes it clear which processes are active.
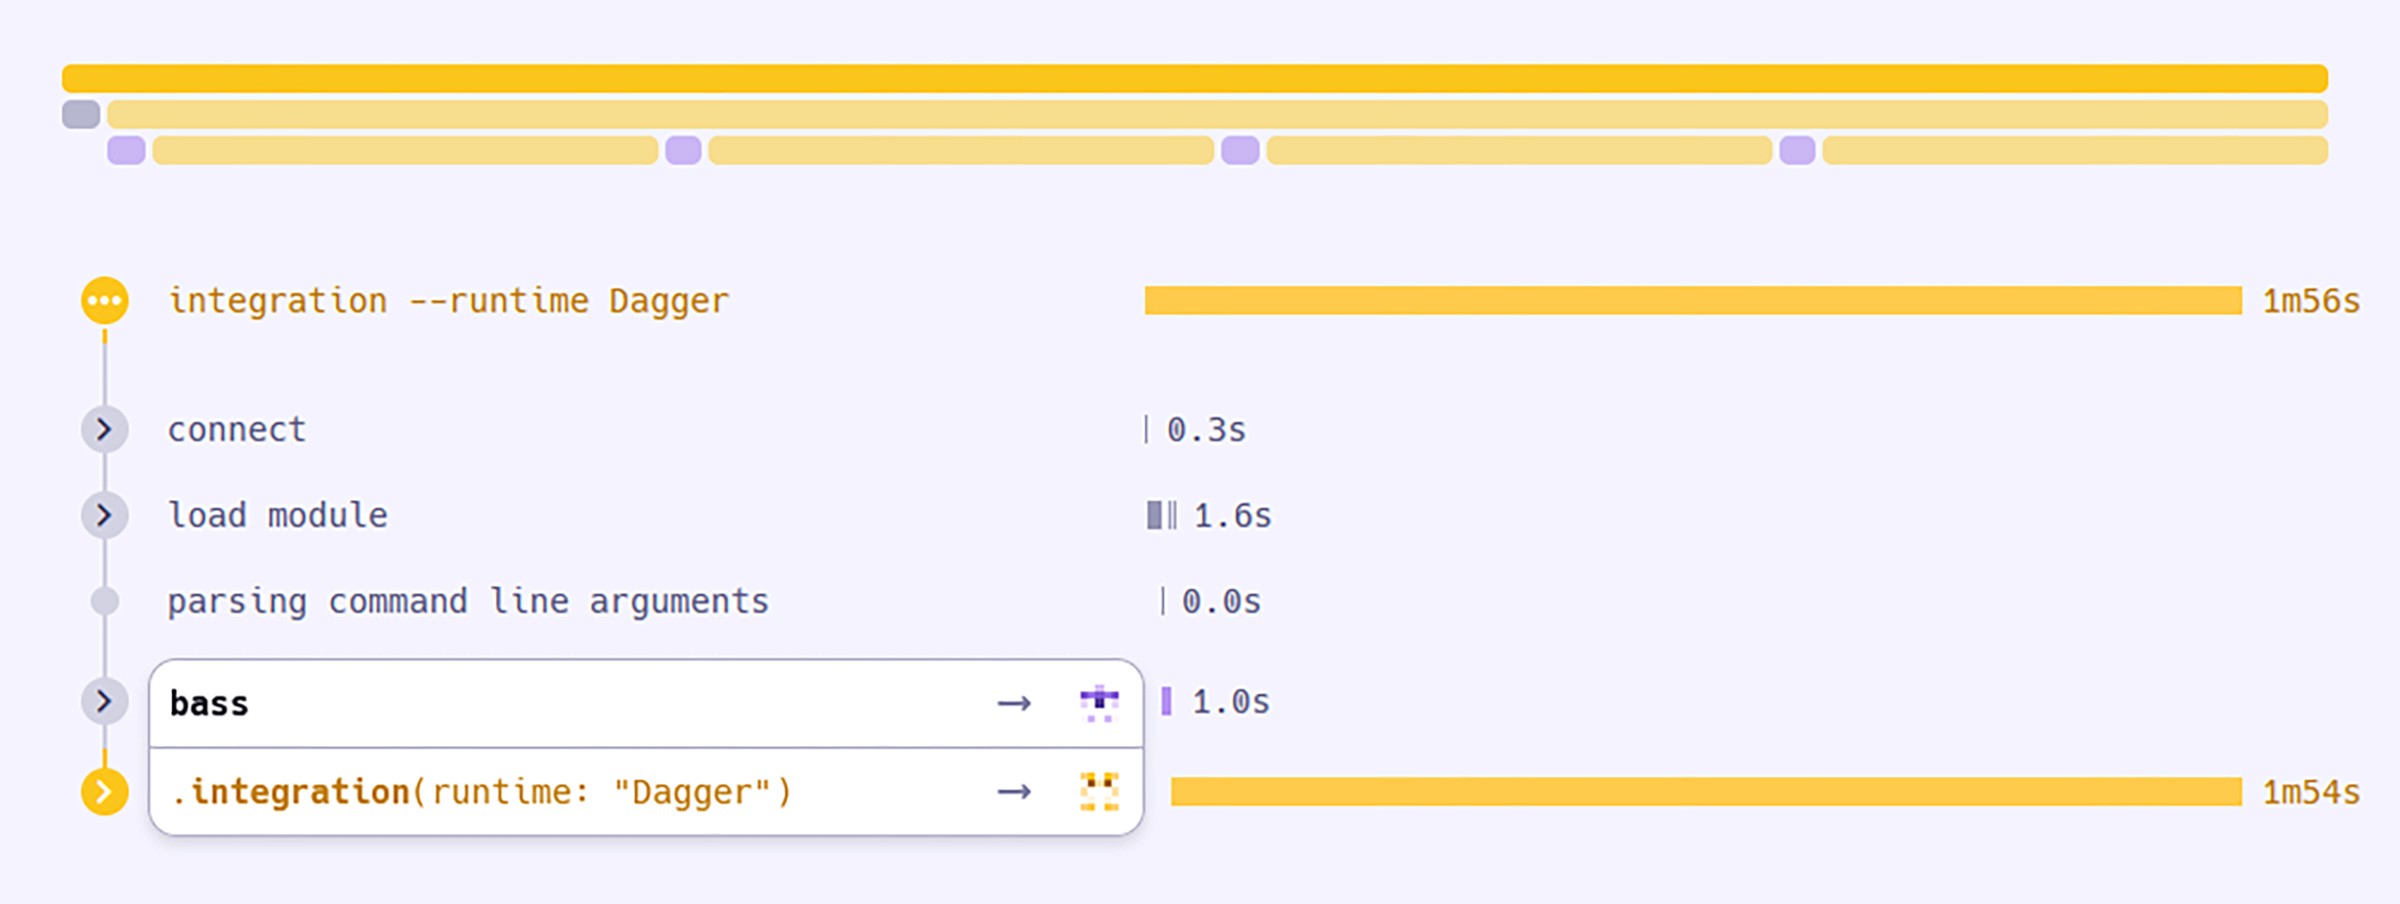
Cancelled Steps: If a step has been cancelled, it’s displayed with an orange indicator. This helps you quickly distinguish interruptions or cancelled jobs when viewing the trace.
Monitor Dev and CI in One Place
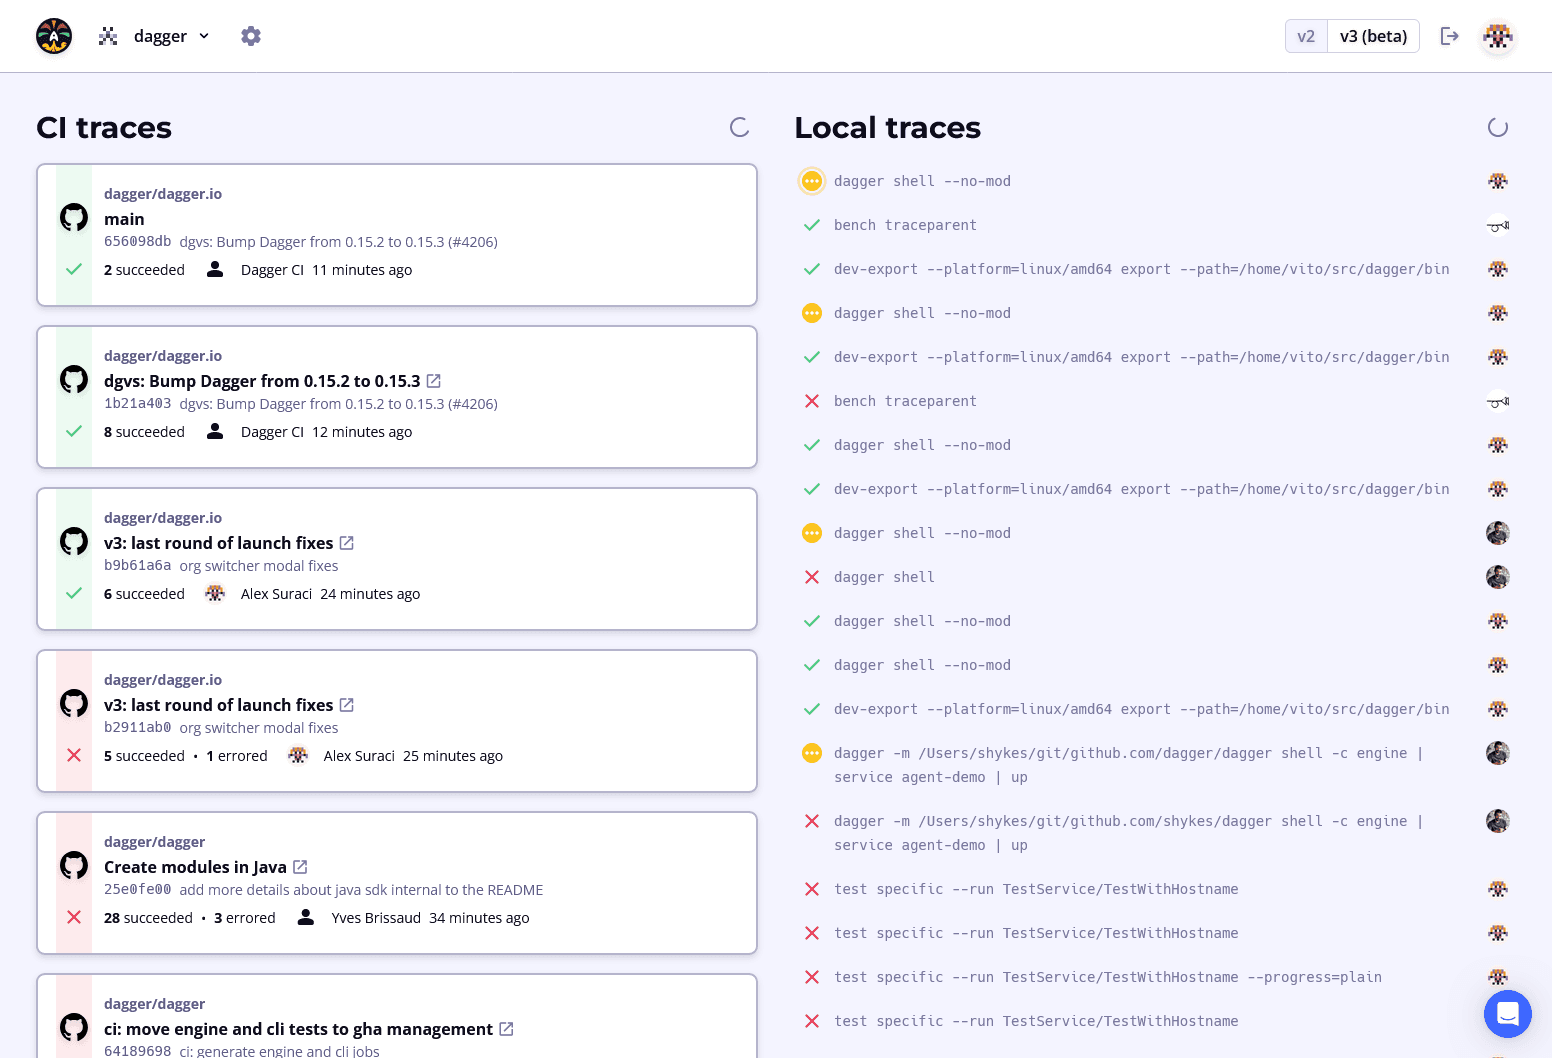
Dagger Cloud v3 now shows two feeds side-by-side: traces from CI, and traces from your team’s local dev environments. This gives you a bird’s eye view of every pipeline running in your organization, and their status, in real time.
Whether it’s failed tests in CI, or a colleague asking for help debugging a complicated build, you can quickly drill down and view the trace of your choice in detail.
In addition to these major changes, you’ll notice smaller improvements throughout the UI, such as:
- Easier access to settings from the top navigation bar.
- A new location for the logout button.
- Other subtle adjustments to make your experience smoother and more intuitive.
Better Support for Large Traces
When working with larger traces (upwards of 100MB), you’ll immediately notice that Dagger Cloud v3 is much faster.
Previously the Dagger Cloud UI would fetch the entire trace’s raw data before rendering. This often resulted in long loading times, especially for large traces and users on slower networks.
We’ve re-engineered how trace data is processed. The heavy lifting is now handled by the backend, instead of the UI, which then streams trace data incrementally to the UI. As a result, instead of waiting for the entire data to load, the UI can start displaying the trace almost instantly. Meanwhile, the backend continues fetching and syncing data over a WebSocket connection in the background.
What does this mean for you?
- Faster loading times: You can start reviewing your trace almost immediately without delays.
- Smoother experience: No more interruptions when navigating through large or complex traces.
Better Handling of Large Log Volumes
Managing large log outputs is now much easier. In v2, logs were rendered all at once. Large log files could slow down your Dagger Cloud experience, or sometimes even crash your browser if the logs were large enough. Searching among logs was also limited to using your browser’s search capabilities, which didn’t make for the best of experiences.
In Dagger Cloud v3 we’ve added two features that make working with logs much smoother:
- Log Filtering: The logs UI now supports filtering log lines. You can quickly search for specific keywords within your logs without having to scroll through thousands of lines.
- Incremental Rendering: Instead of rendering all log lines at once, which could previously crash or freeze your browser, the new UI renders the last 1,000 lines first and lets you opt in to load additional lines in batches. This ensures a crash free experience even with very large logs.
These two features complement each other: filtering happens before incremental rendering, so when you search for something, you’ll see the first 1,000 matches instead of matches only within the last 1,000 lines of logs.
Breadcrumbs for Easier Navigation Within Traces
There are some times when you have to dig down multiple spans when trying to debug or look for something in your traces. Previously, once you were in the weeds of a trace, following your way back to a particular parent span often required unnecessary clicks. Not only was it hard to navigate back, but it was also tough to keep track of your current location in the tree.
We fixed both these issues in v3 with the introduction of breadcrumbs when navigating within traces.
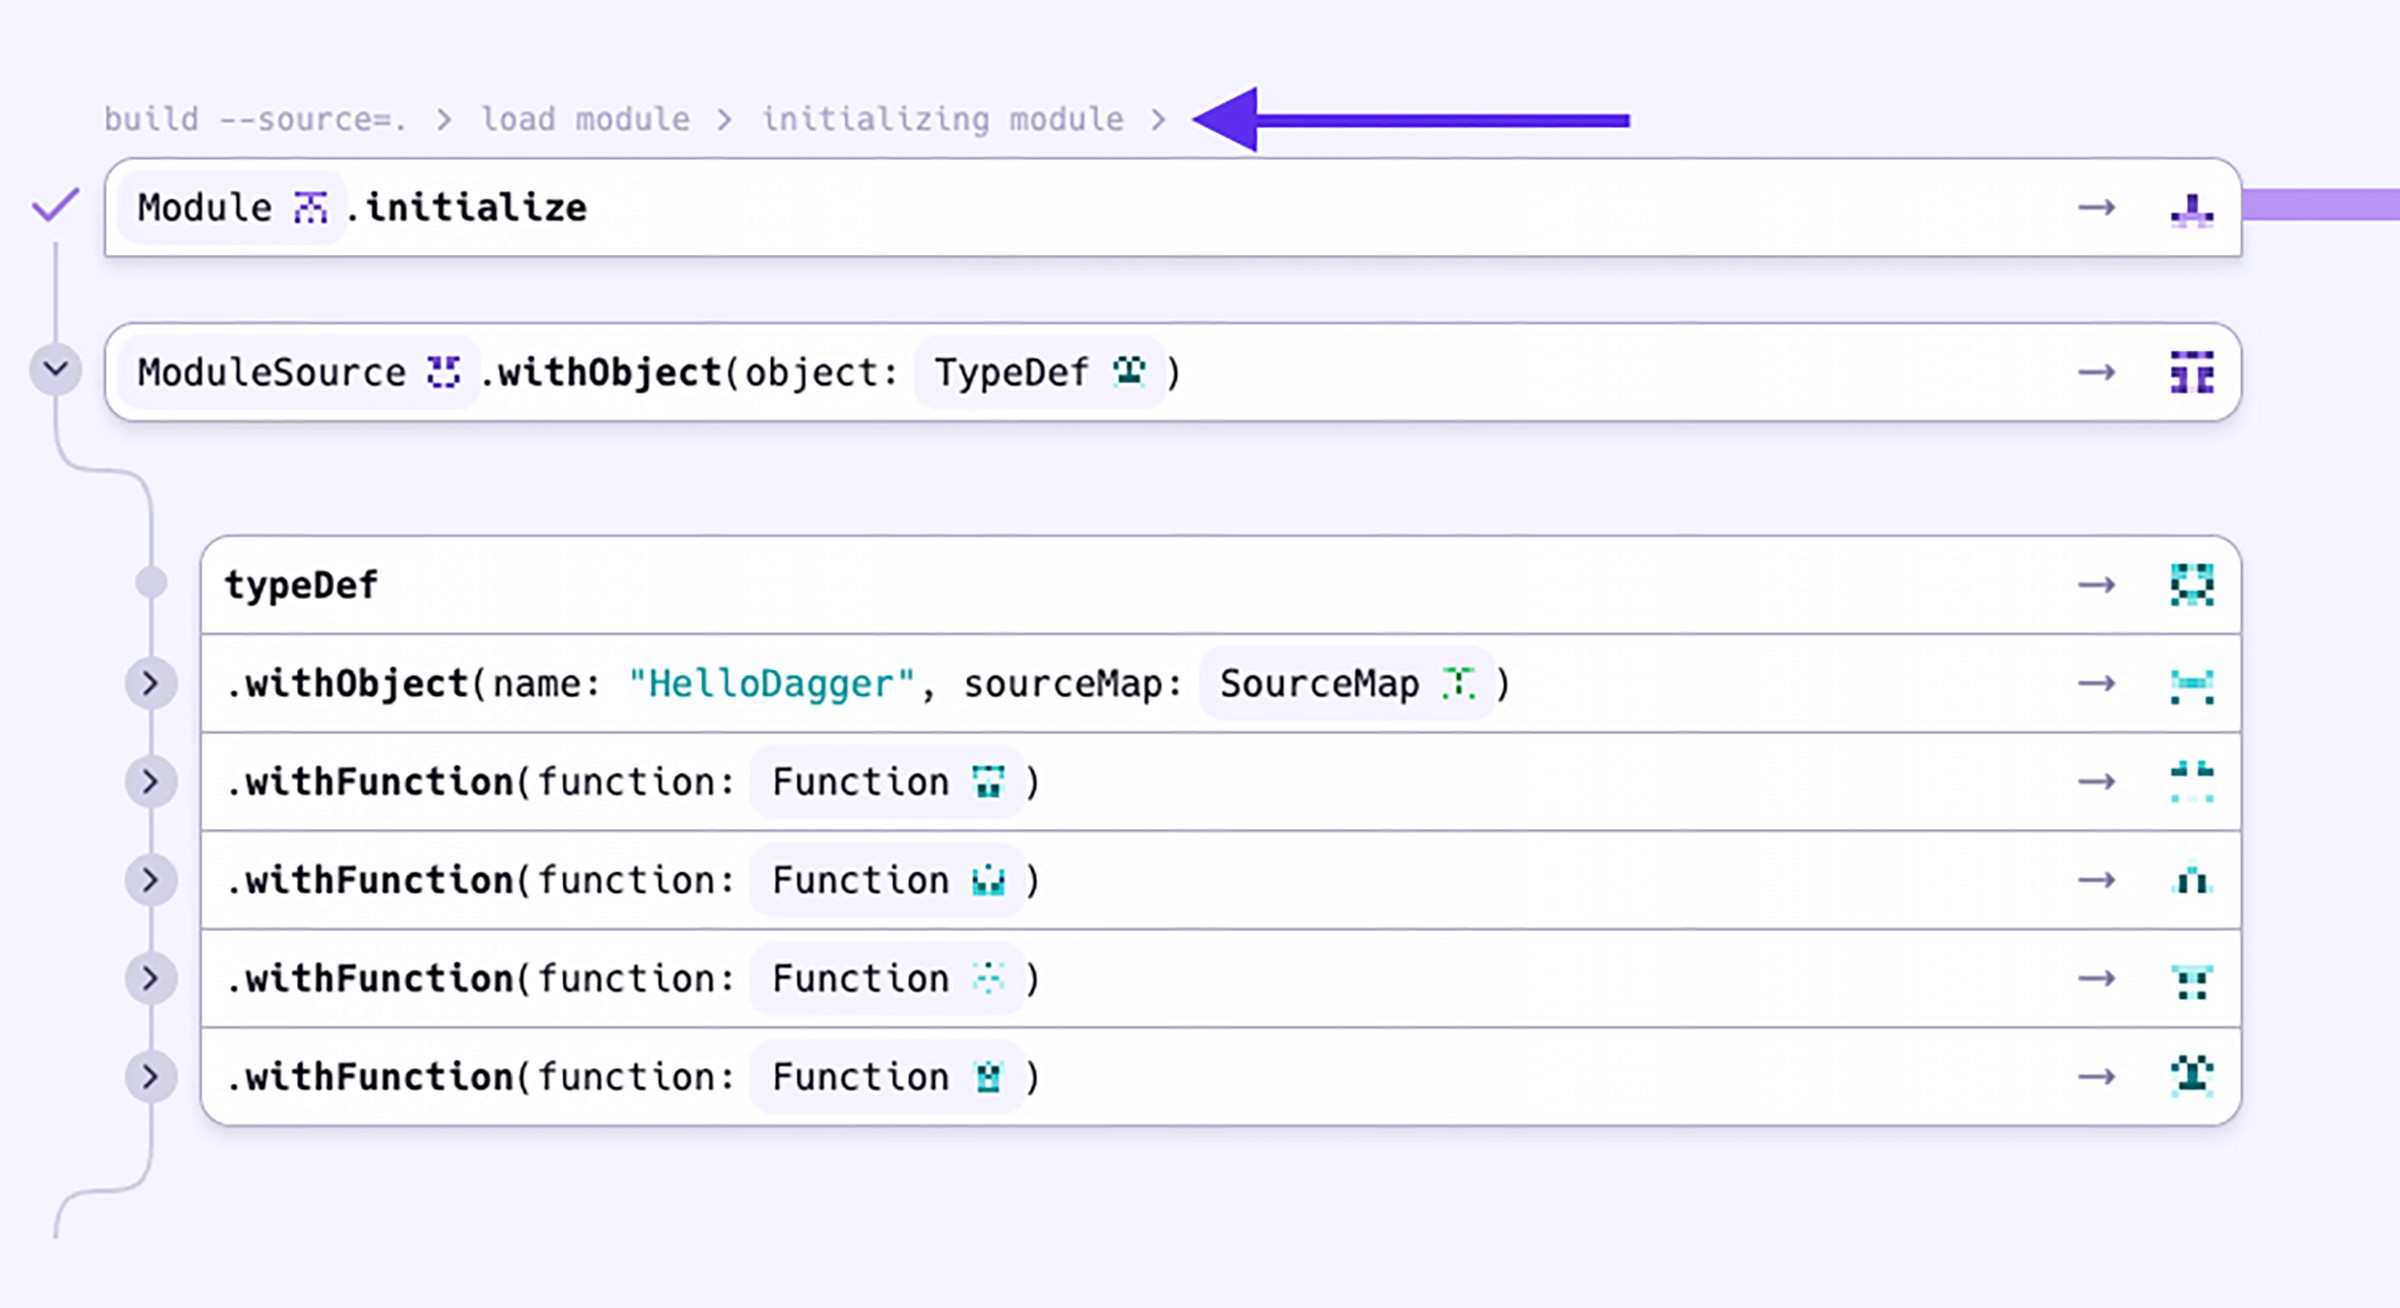
Breadcrumbs let you see the complete context of any span within the trace all the way back to the root, allowing you to quickly jump between different parent spans without the hassle of stepping out one level at a time.
We also added breadcrumbs to the top of error logs, giving you immediate visibility into where the error occurred within the trace hierarchy.
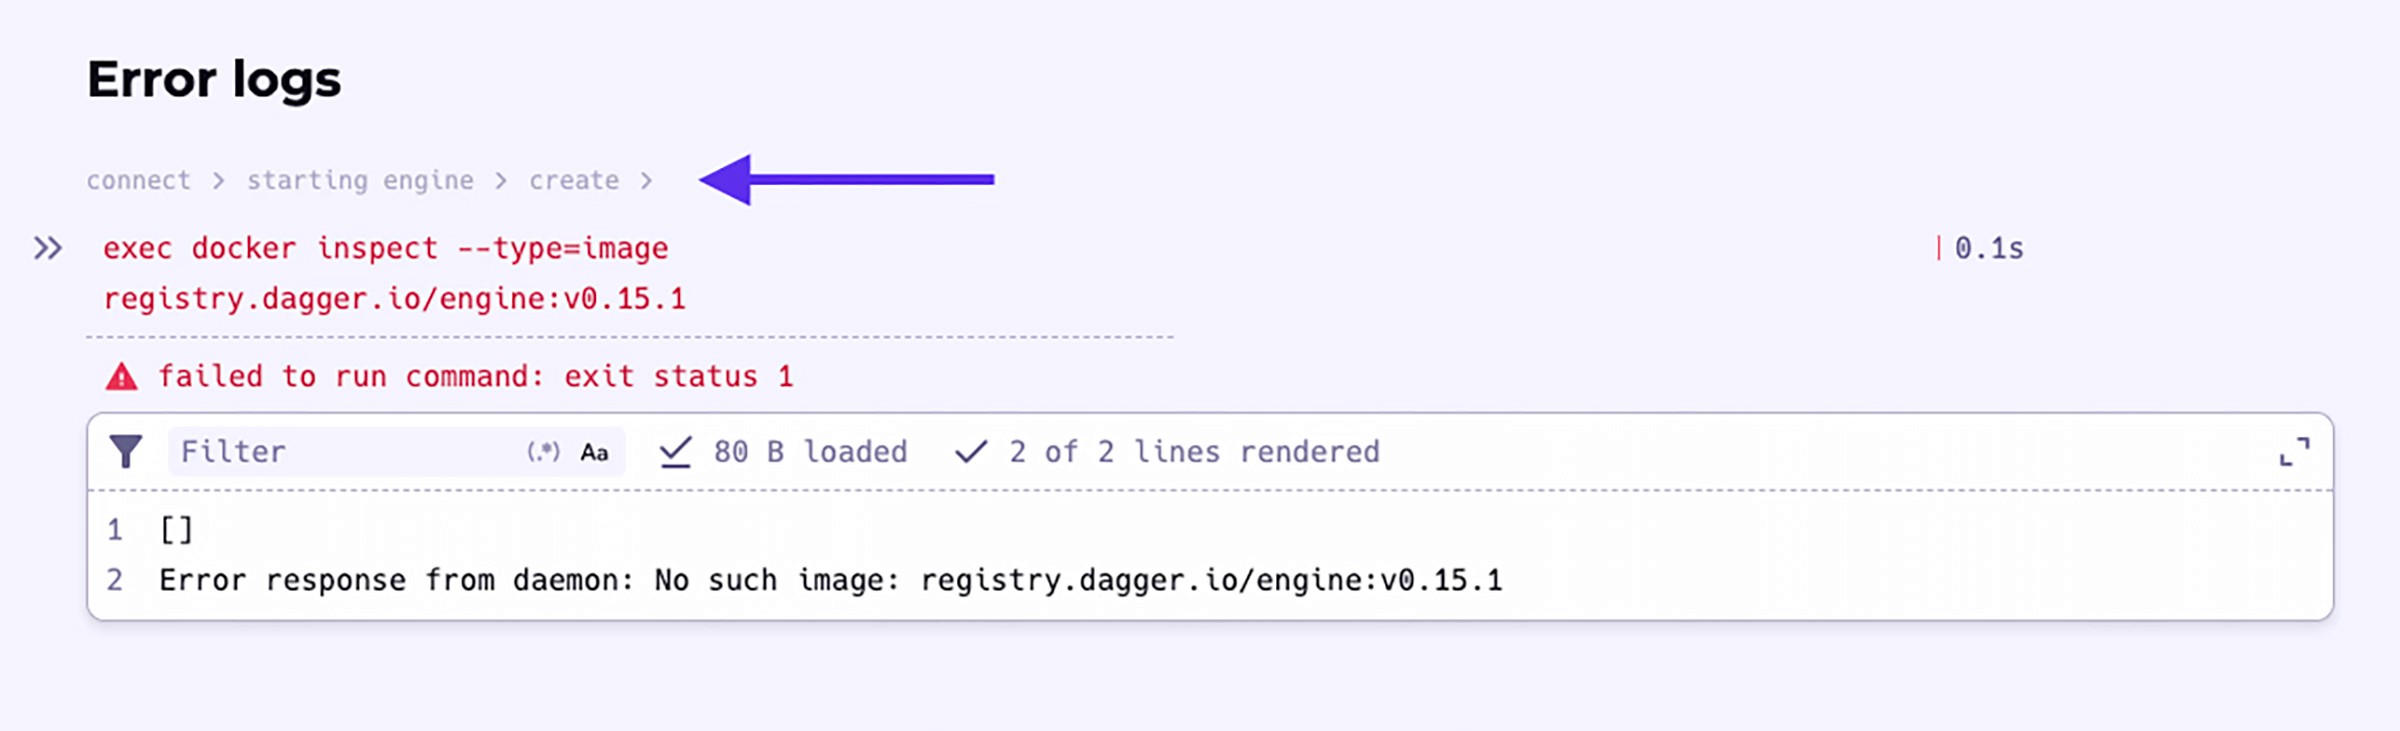
This makes debugging faster by letting you trace the root cause of the error easily.
Dark Mode and Light Mode
One of the biggest debates in software engineering circles is dark mode vs. light mode - which one makes you a 100x engineer? :P
Well we wanted to respect everyone’s preferences, so Dagger Cloud v3, you can toggle between dark mode and light mode based on your preference. By default, Dagger Cloud will follow your system settings, but you can change it anytime in the user Settings.
Ready to Experience Dagger Cloud v3?
Dagger Cloud v3 is a major step forward in allowing developer teams to iterate and ship faster. From the adoption of WebAssembly for a unified, high performance UI to better error readability, enhanced trace visualization, and smarter log handling, this new release is all about empowering you to focus on shipping instead of wrestling with CI.
To opt into v3, simply log in atdagger.cloud, and you’ll have the option to switch to the new version. Once opted in, you’ll be redirected tov3.dagger.cloud, where you can explore all the new features and improvements.
Please note that v3 is still in beta and your feedback is very much appreciated and encouraged. We’re excited for you to try it out andlet us know what you think!