Introducing Dagger Traces: Debug and Monitor your Dagger Functions
What do you do when something fails in your Dagger pipeline? If a teammate shares failure logs with you, how do you collaborate to resolve the problem? For many, that process has included sharing raw logs or combing through CI run logs to determine the root cause.
To assist with debugging and optimization, we’ve introduced a new beta view in Dagger Cloud: Traces.
Traces addresses a core need for people working with Dagger: something failed, now what? Did it fail because something timed out? Is it because there is a bug in how the pipeline and its Functions were authored? Or is something wrong with the actual code being built and tested?
Why did we make Traces?
Traces provides a UI to debug what went wrong when something fails, focusing on tracing what happened and when it happened. Traces also helps you optimize your Dagger Functions and modules as you author them by giving you the detailed step-by-step execution of your pipeline and the associated telemetry. This is equally useful for debugging pipelines running on a developer’s local environment as it is for pipelines in CI.
Here are some new features included with Traces. We’ll follow up soon with more posts and how to use Traces for a range of use cases.
- Trace upstream and downstream operations
- Find performance bottlenecks
- Collaborate with your team to debug and author pipelines
- Integrate with GitHub Checks to see real-time status and the exact calls used
- Easily tell how long your pipeline took to run, including every step
- See which Functions were called and see docs for them in the Daggerverse
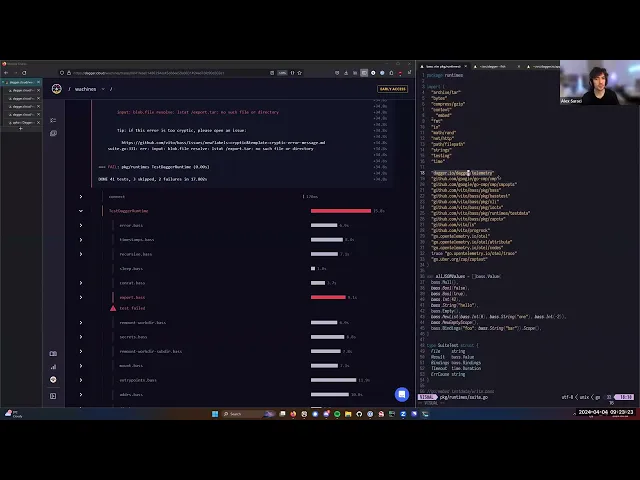
This video shows Alex Suraci using Traces to debug a pipeline failure.
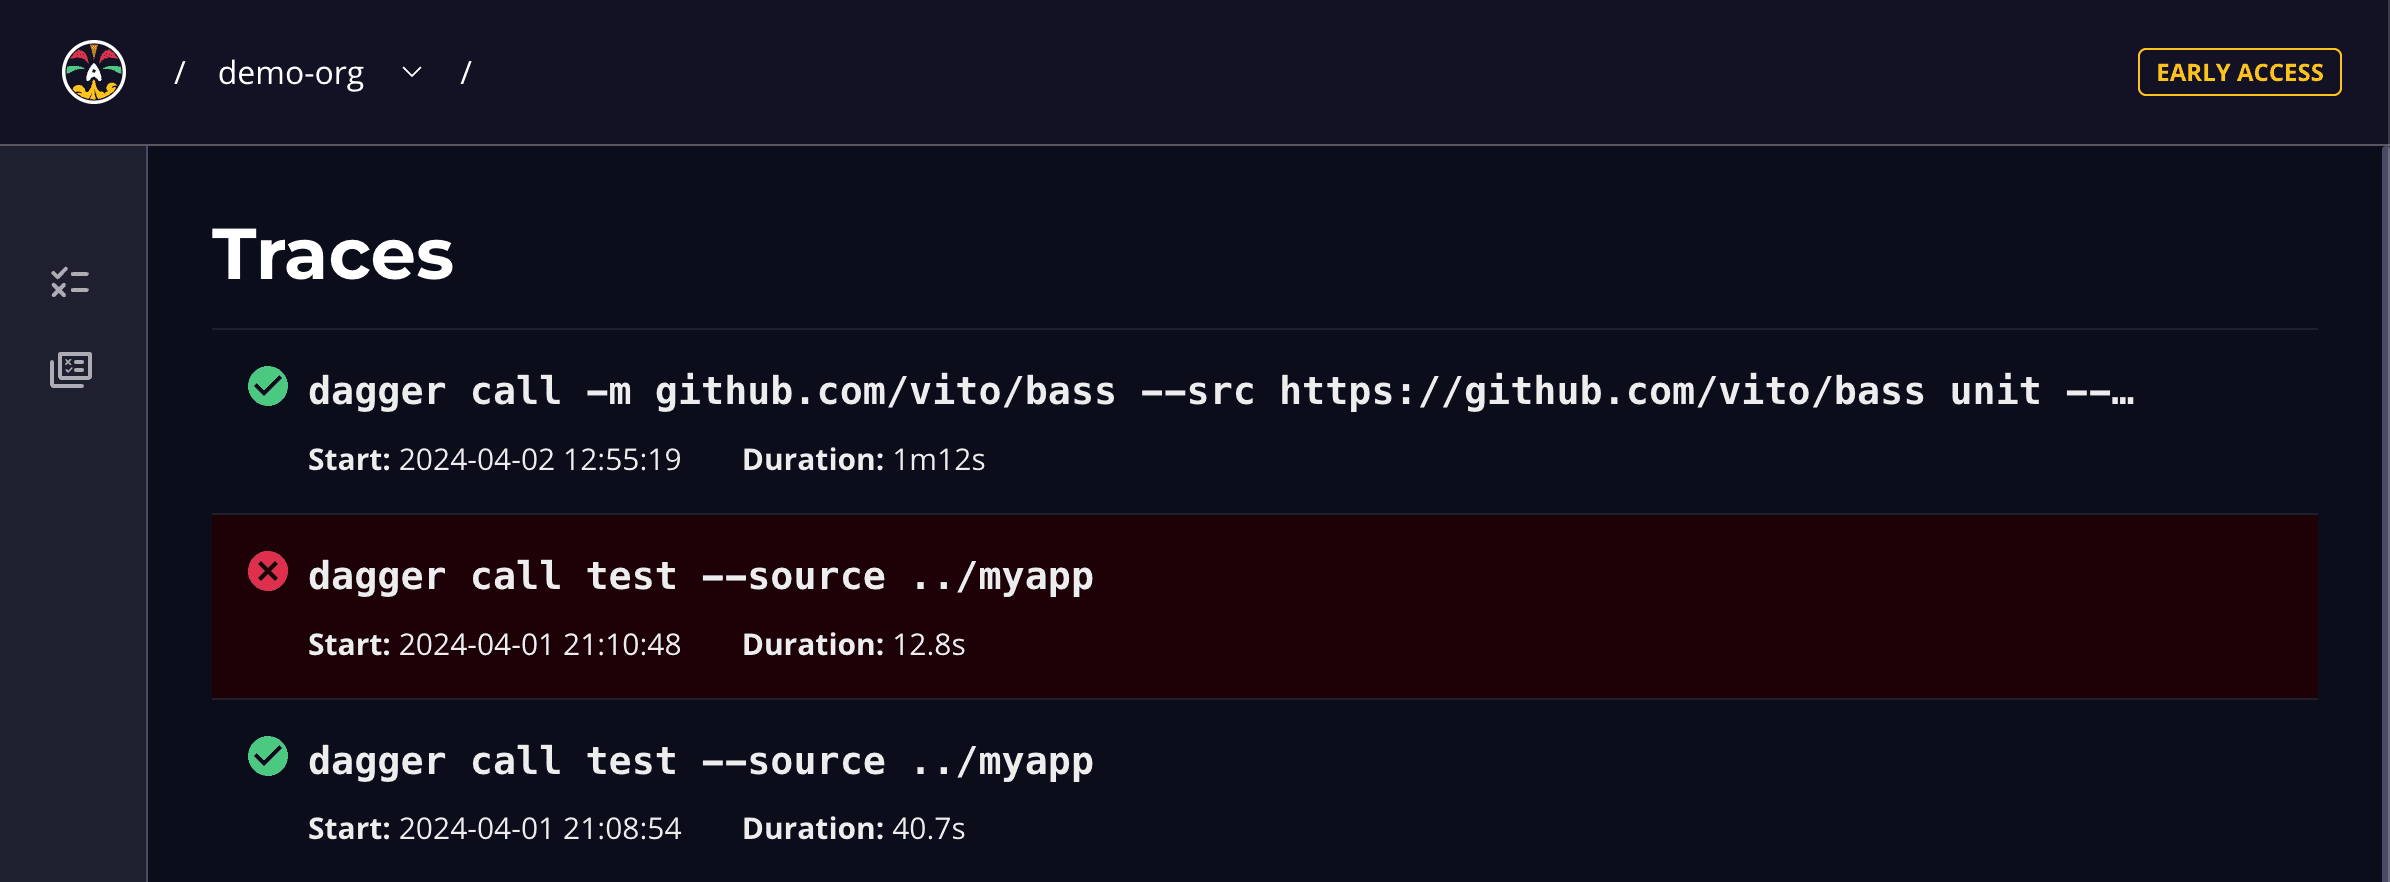
See your Traces on the All Traces page
Click into a Trace to see its detailed breakdown.
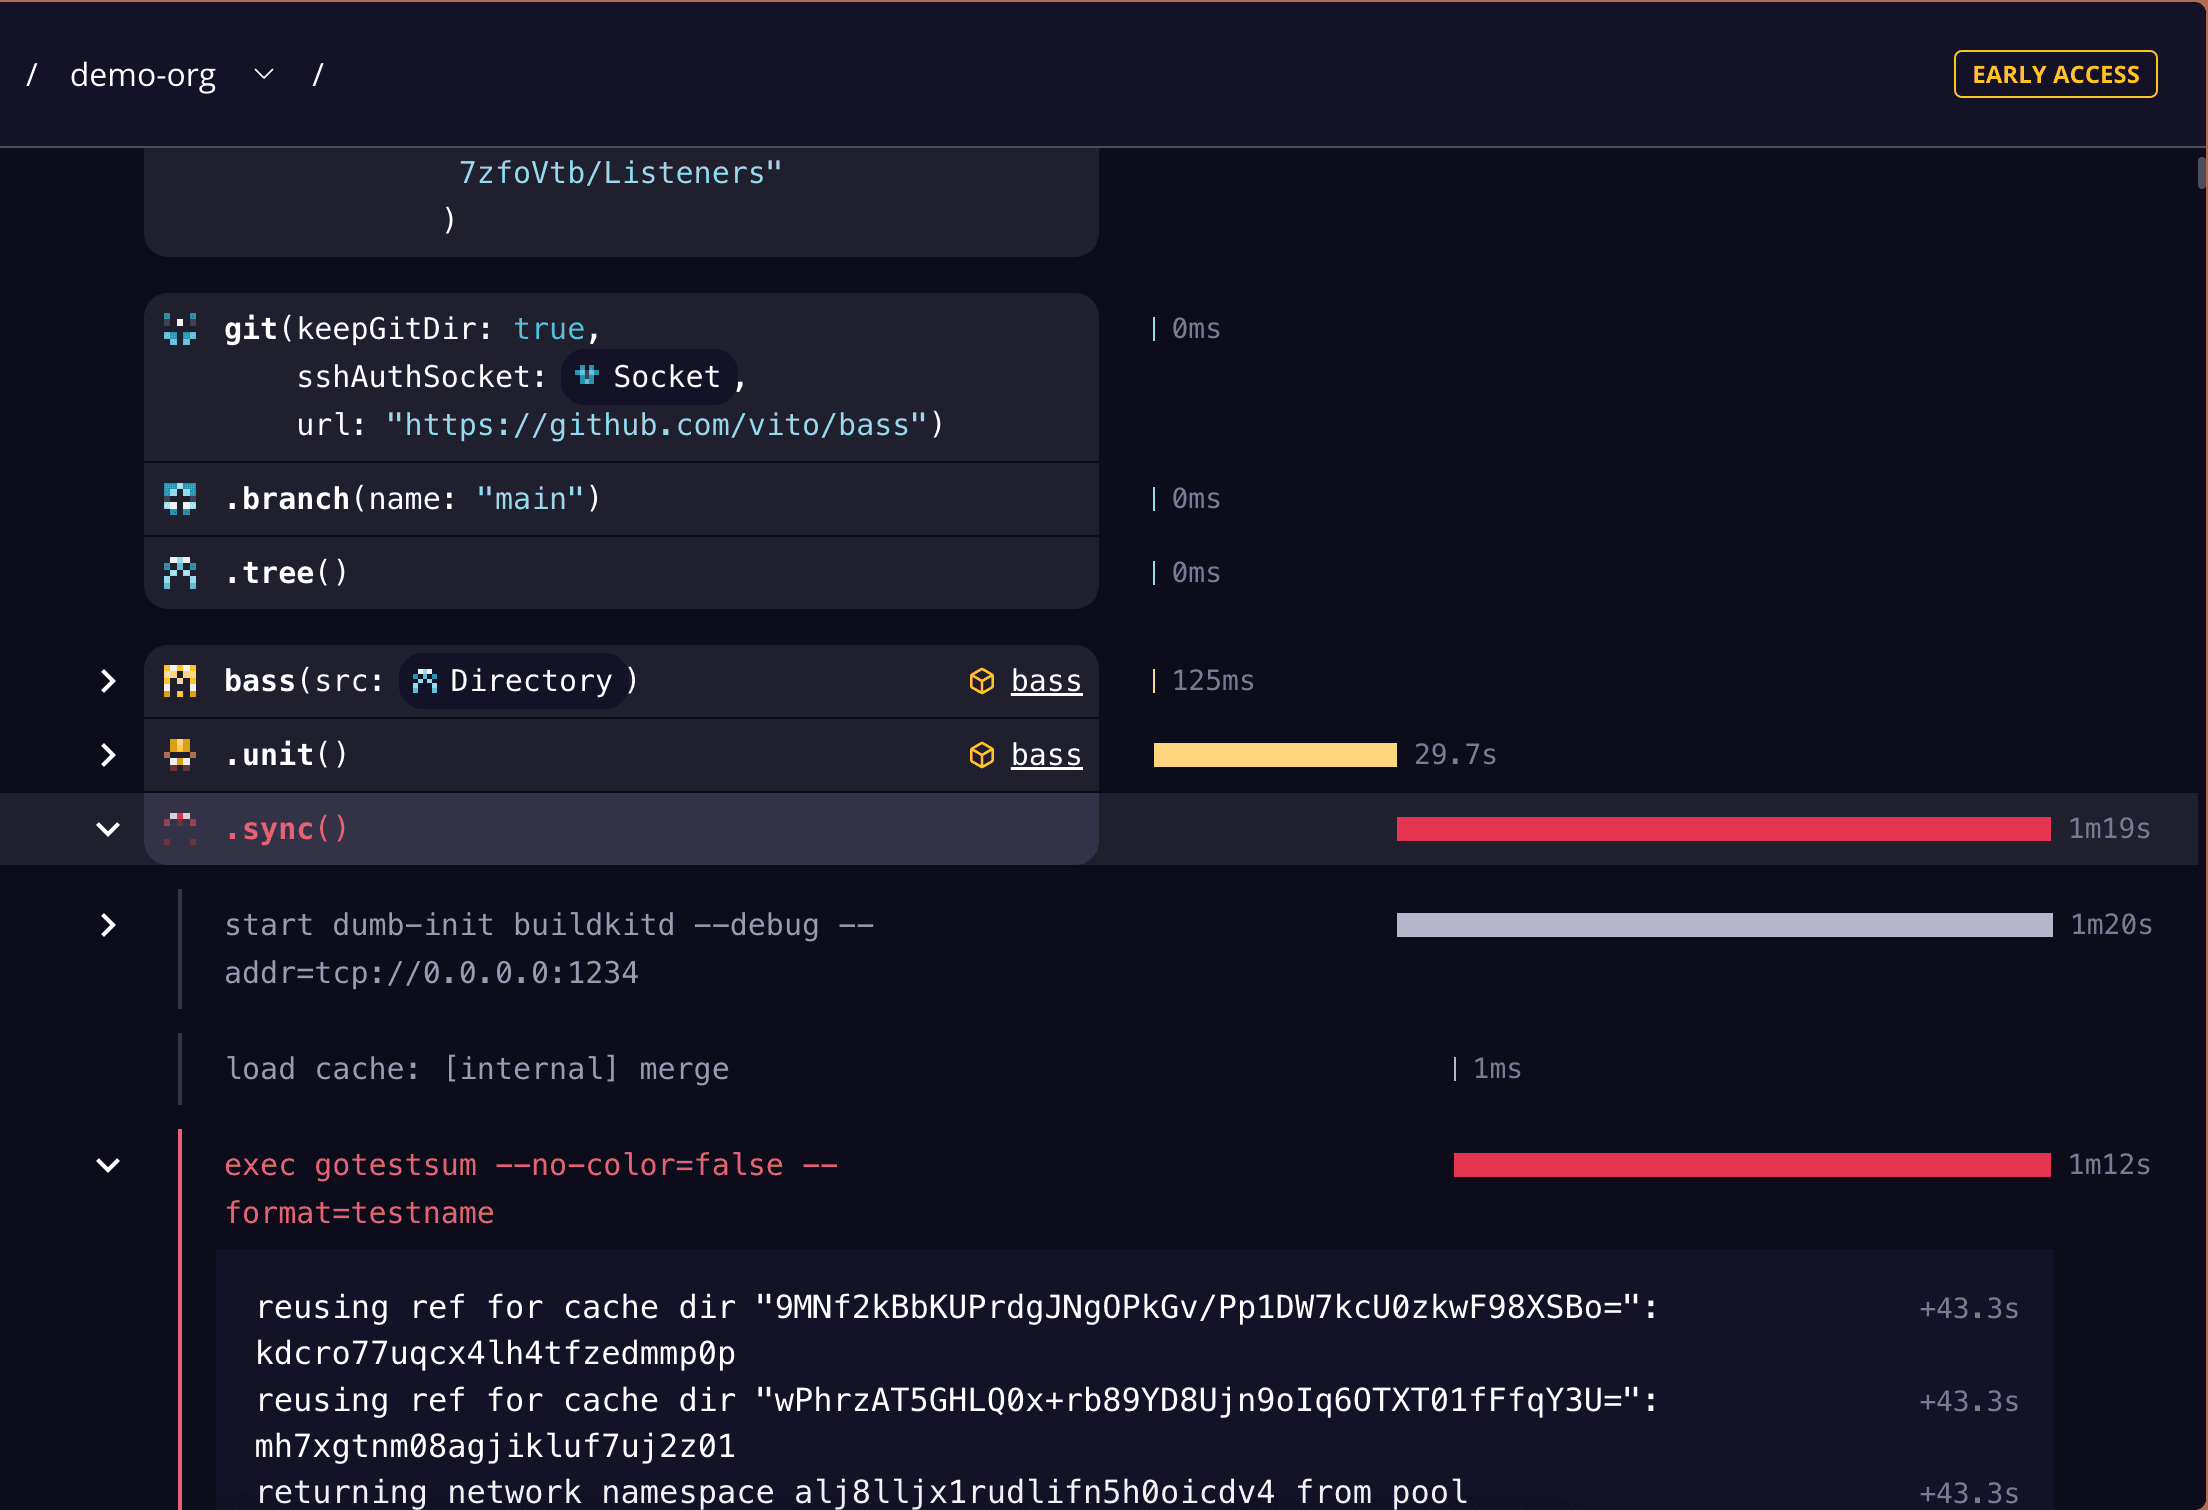
Debug an error in the Trace Details page
Use a Trace’s details page to debug failures and identify bottlenecks.
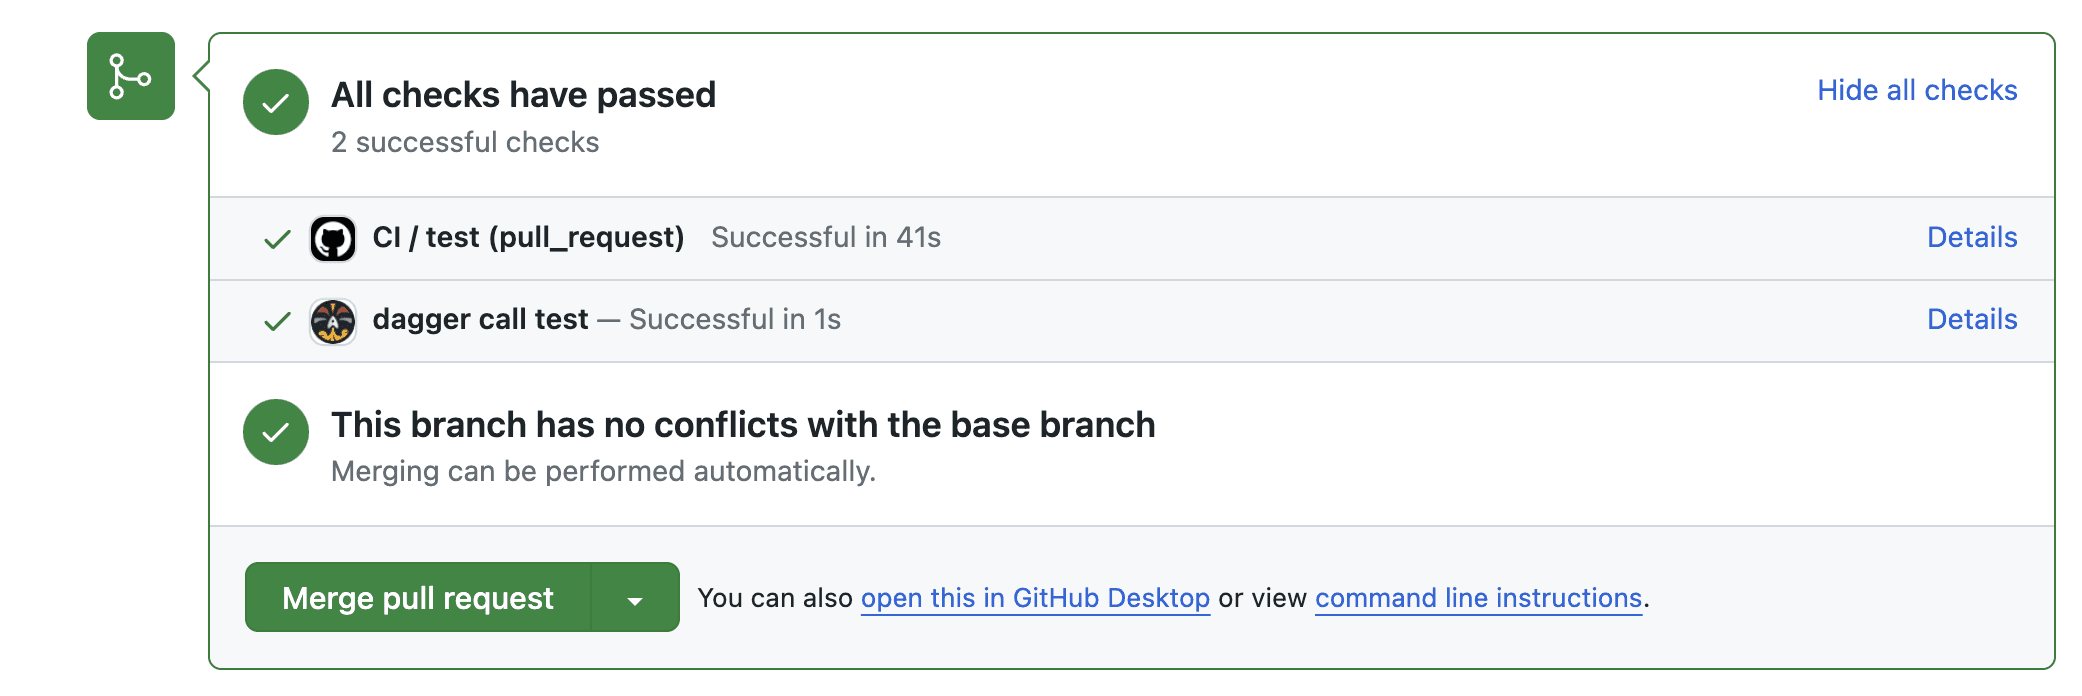
Improved GitHub Checks integration with real-time status
The Dagger GitHub app now shows the exact functions you have called for each commit, with their status, in real-time.
How can you try Traces?
Upgrade your Dagger Engine to version 0.11 or later.
- If you don’t have a Dagger Cloud account, create one for free.
- On your local machine, you simply set an env variable. In your CI environment, you can use our integrations (including a GitHub app).
- Each time your engine calls a function, a new trace will automatically appear in your Dagger Cloud account.
That’s it! No other configuration is required. To learn more about the new UX, see the Dagger documentation.
Things to know
- **Traces requires upgrading your Dagger Engine to 0.11.0.**We built Traces with OpenTelemetry, which has changed the Dagger telemetry API. Because of this change, you need to upgrade your Engine version to use Traces. For people using Dagger Cloud with earlier versions, your pipeline runs using
dagger runanddagger callwill appear in the Runs and Changes views. Once you upgrade your engine, bothrunandcallappear in the Traces views. - The terminal UI has changed. The interactive tree and DAG views for
dagger runare no longer in the terminal UI. - The Dagger Cloud URL isn’t printed in the terminal UI for newer engines. We’re working on adding this feature. To view your local run, go to the Cloud UI directly at https://dagger.cloud.
- **We’re actively developing Traces.**Because Traces is in beta, the UI might have some rough edges. We wanted to get this out to you for testing as soon as possible and are updating it rapidly.
What’s next
We need your feedback on the beta to improve Traces. Dagger’s Discord is a great place to ask questions and share your feedback with the team and other Daggernauts. You can also submit feedback in the Dagger Cloud UI via the in-app support chat or by submitting an Issue in GitHub.
We’re working on adding new features to improve insights across your Dagger pipelines and add more collaboration features. Stay tuned to learn more.