Platform

Resources

Community

Platform

Resources

Community

Introducing Public Traces for Open Source Repositories
November 6, 2024

Nov 6, 2024

Share
Share
Share
Share

We’re excited to announce a new Dagger Cloud feature: Public Traces for Open Source Repositories. This functionality allows open source project teams to share trace data from Dagger pipelines publicly, helping communities collaborate more effectively and troubleshoot issues with greater transparency. Here’s a closer look at how it works and why it’s a game-changer for open-source projects.

What Are Traces, and Why Are They Useful?

The Dagger Cloud Traces feature provides in-depth visibility into the steps, execution times, caching states, and other metadata associated with Dagger pipelines. Traces help engineers and DevOps teams understand exactly what’s happening in their workflows, identify bottlenecks, and troubleshoot failures efficiently. Traditionally, access to this trace data has been restricted to authorized users within an organization—until now.

With this new feature, open-source repositories connected to Dagger Cloud can make their traces accessible to anyone. This opens up opportunities for community contributors to view, diagnose, and discuss CI issues without needing special permissions, making collaboration seamless and efficient.

Sharing Public Traces

Imagine you’re working on an open-source project and need help understanding why a particular pipeline failed. With public trace access, you can easily share a link to the trace with others to get their input, saving time, and avoiding the hassle of extensive log scrolling.

Here’s how it works:
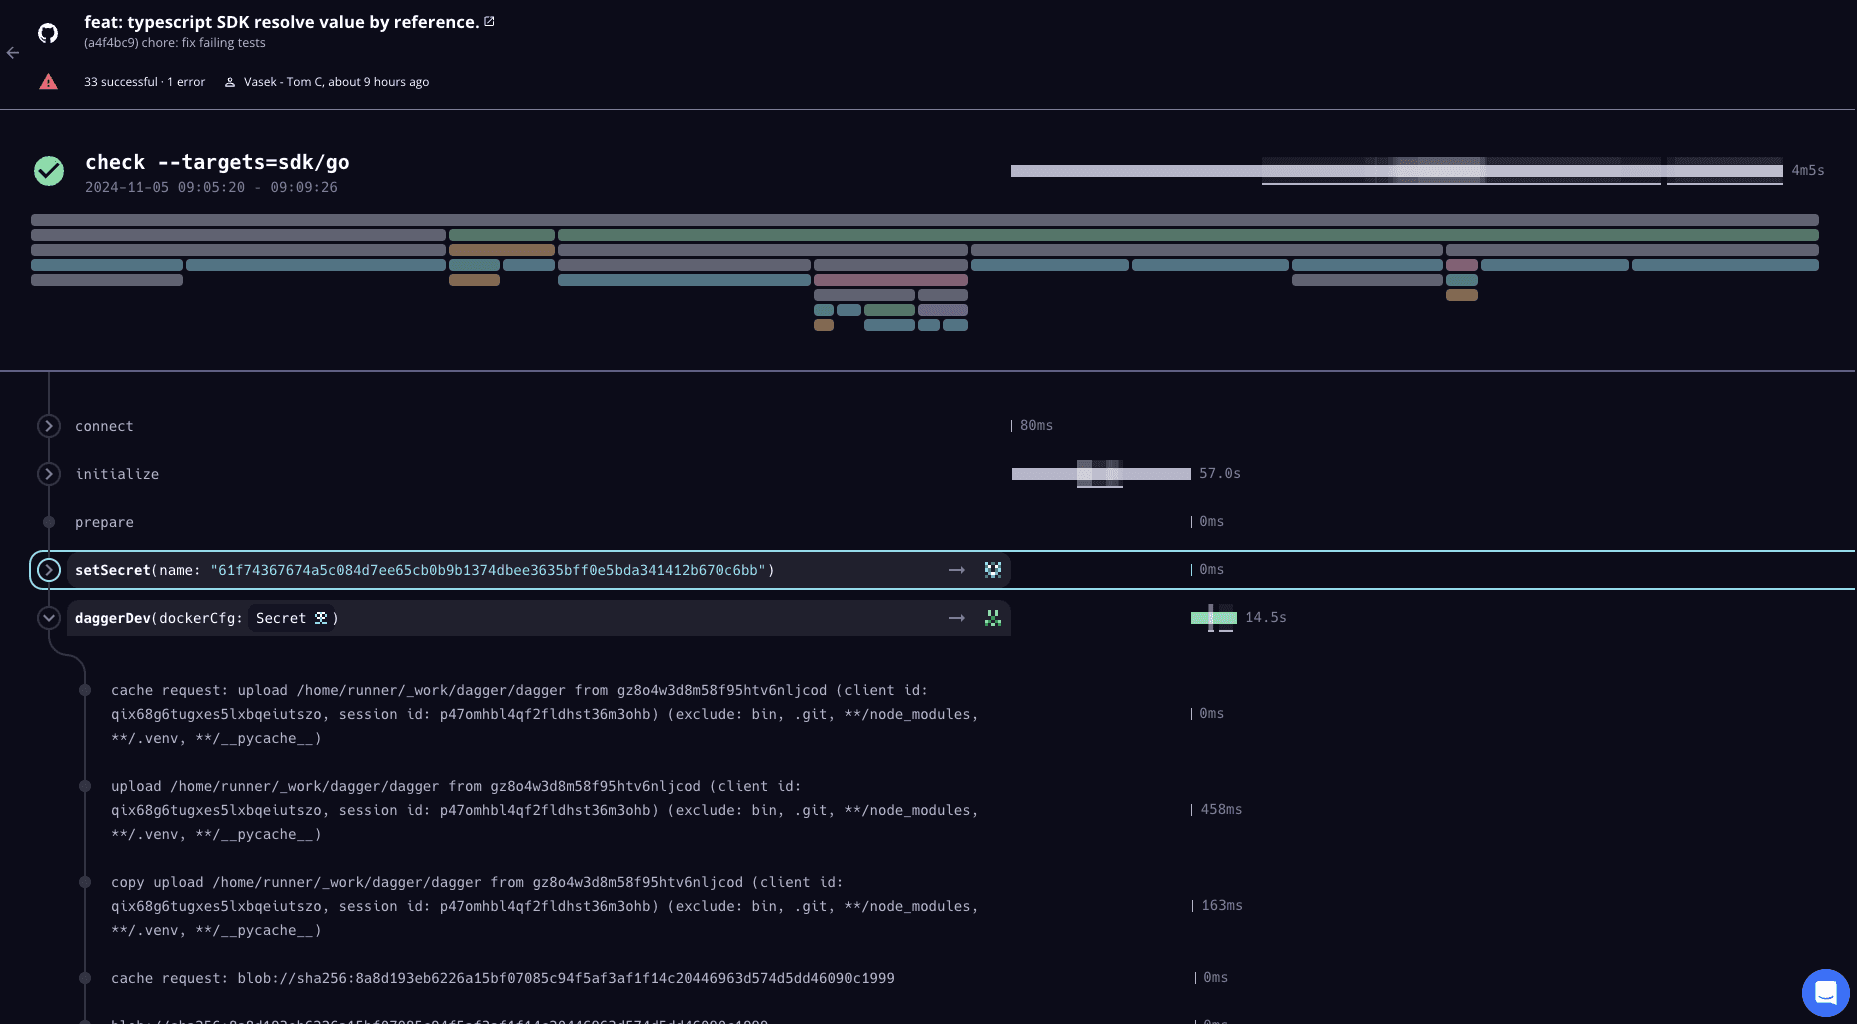
  1. Viewing a Trace: Start by navigating to any trace as you would in Dagger Cloud. The trace view provides detailed insights into every pipeline span, including execution times, caching states, and error messages.

  2. Identifying the Error: In cases of failure, public traces allow you to see exactly where things went wrong. You can jump directly to the failed span to examine the error details and related logs without having to wade through endless CI/CD logs that lack context.

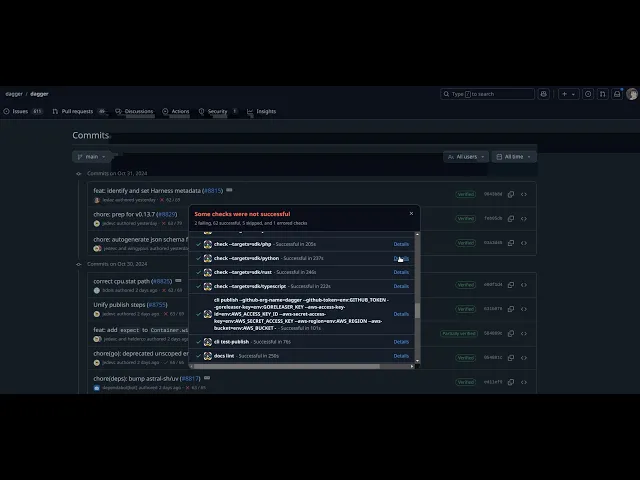
  3. Easy Collaboration: Before today, sharing trace details meant taking screenshots or complicated log exports. Now, you simply copy the URL of the trace and share it with contributors. They can view the trace data directly without needing to be logged into your Dagger Cloud organization. They don’t even need their own Dagger Cloud Account. Alternatively anyone looking at your PRs on Github etc. can now see Traces associated with this PR from the Dagger Check entry.

You can take a look at a demo of the feature here:
Configuring Public Trace Visibility

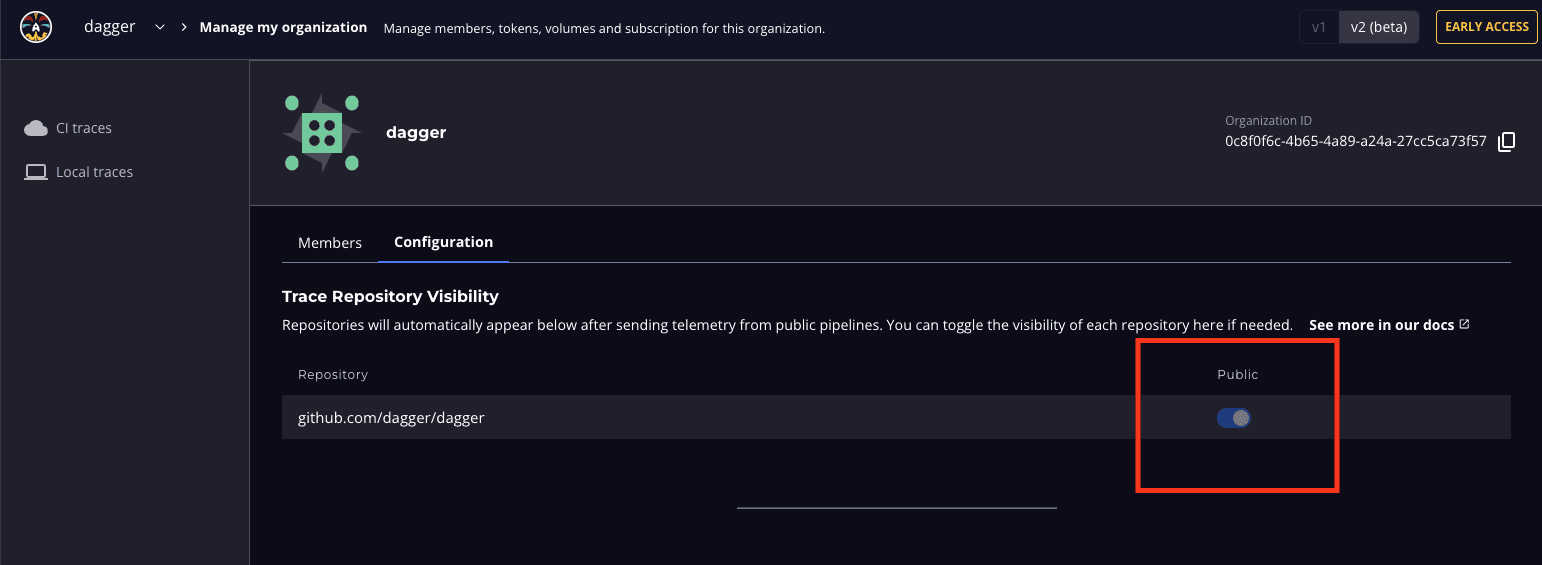
Since Public Traces just provides better visualization of information that is already public, we have the feature on by default. There is, however, a Trace Repository Visibility setting for anyone prefering to have it off. Here’s how to manage it:

  • Default Behavior: Dagger Cloud automatically detects traces generated by public repositories and makes them accessible.

  • Managing Visibility: To turn off public traces, go to your organization settings in Dagger Cloud and select the Configuration tab. Toggle the Trace Repository Visibility setting to enable or disable public access to traces. Once turned off, anyone attempting to access a trace without permissions will be redirected to the login page, ensuring that only authorized users can view it.
Getting inspired by others

For those getting started with Dagger, a common pattern is to go look for examples of others who have Daggerized their pipelines. Here’s an example from Airbyte’s Public GitHub. Since Airbyte is a Dagger Cloud user with a large number of Daggerized pipelines, most of the PRs on their public repos will show Dagger checks before they are merged. Clicking on details next to the Dagger Check will now open the corresponding Dagger Trace, even if you’re not a Dagger Cloud user yourself, allowing you to see the details of each pipeline span, including execution times, caching states, and error messages.
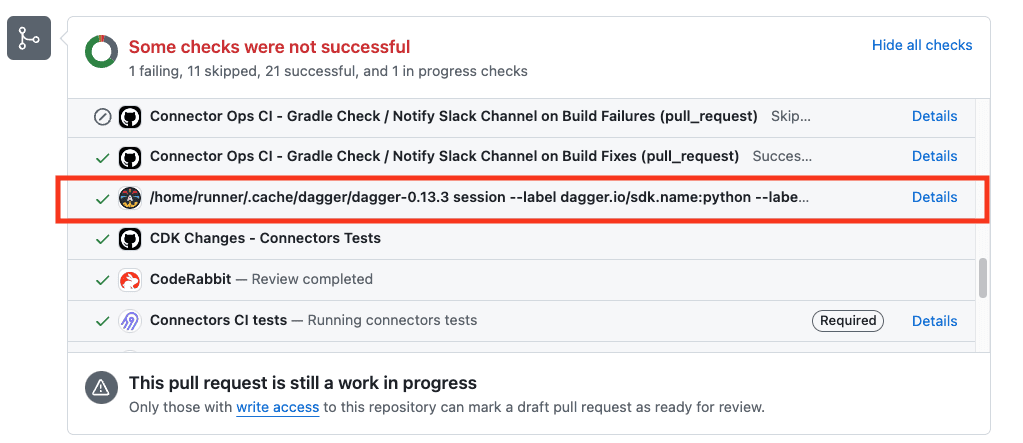
You can see the trace for this PR here: https://dagger.cloud/airbyte/traces/6db4e8d438d420eaa2fa0fefd08708f2

A New Era for Open-Source CI/CD Collaboration

With Dagger Cloud’s Public Trace feature, we’re opening new doors for the open-source community. Contributors can now troubleshoot, diagnose, and enhance workflows together in real time, improving transparency and reducing the turnaround time for bug fixes.

We’re thrilled to bring this feature to our users and look forward to seeing how open source teams use it to streamline their CI processes. As always, we’d love to hear your feedback. Reach out with any thoughts or questions on Discord!

Thank you for being a part of the Dagger community.

Get Involved With the community

Discover what our community is doing, and join the conversation on Discord & GitHub to help shape the evolution of Dagger.

Subscribe to our newsletter

Get Involved With the community

Discover what our community is doing, and join the conversation on Discord & GitHub to help shape the evolution of Dagger.

Subscribe to our newsletter

Get Involved With the community

Discover what our community is doing, and join the conversation on Discord & GitHub to help shape the evolution of Dagger.

Subscribe to our newsletter